
Quick and Easy Sensor Visualisation with No Code Needed
- Oliver Schenk

- Jan 16, 2024
- 5 min read
In this post we will talk about an approach that you can use to visualise data and create alerts in a matter of hours for one or a handful of sensors without having to invest in software development or procure and deploy expensive IT infrastructure.
In essence, we will cover the concepts of how to implement a complete "data journey" that was described in my previous post The Data Journey: From Sensor to Business Value using a no-code approach.
Just to recap, the data journey includes the following steps:

We will leverage the IoT suite of services provided by the Amazon Web Services (AWS) cloud platform, which allows you to get started very quickly without compromising on security or reliability and at almost no cost. Using these services you can securely ingest data from an MQTT compatible gateway, model your site and present the data in a modern Grafana based dashboard for visualisation and alerting.
There is one caveat that should be mentioned - this solution works great if you have just one or a handful of sensors and you can configure the gateway and AWS IoT services manually. Once you start dealing with dozens or hundreds of sensors then you will have to invest in automation otherwise your productivity and change management will very quickly become overwhelming.
Let's get cracking!
Before we get into data ingestion and beyond, let's look at the sensor and communication equipment that was used in this example.
The sensor is an RTD temperature sensor for measuring temperature.

To convert an RTD signal into voltage or current we need to use a signal converter or transmitter. This guide used the APCS SL340-20 universal transmitter. This converts the RTD signal input into a voltage signal output.

The final piece of the puzzle is to measure the voltage, put this into a data packet and transmit the data via MQTT to AWS IoT. You can use a data acquisition device such as an RTU or PLC and connect this to a modem or a network switch, but since we only have one analogue input we can save on equipment cost by using a Teltonika RUT956 LTE router.
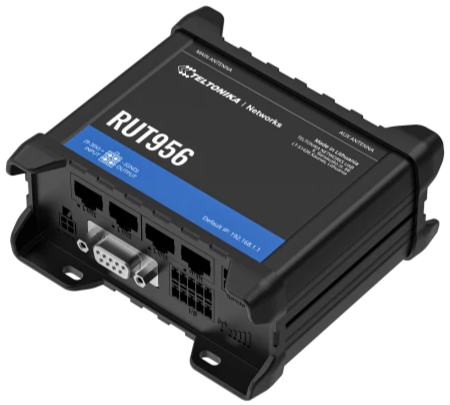
The benefit of this router is that it supports a small set of digital and analogue inputs and provides LAN, WiFi and LTE connectivity. This is perfect for a user case where we only need one analogue input. It also supports Modbus, MQTT and integration with AWS IoT.

In the above image you can see a reading of 3.08V connected to the analogue input. The value of the analogue input is exposed by a Modbus TCP server address within the router. We just have to configure a Modbus TCP client and read that value.


The router can then convert this into an MQTT data packet which looks something like this. The "t" value is a timestamp and the "d" value is the voltage in millivolts.
{
	"t": 1704871985,
	"d": 3035
}
With the above equipment we now have the Sensor and Gateway parts of the data journey sorted.
Let's look at the Ingestion part.
The ingestion of the data and the remaining steps of the data journey is going to happen using some key AWS cloud services. These are:
AWS IoT Core
AWS IoT SiteWise
Amazon Managed Grafana
Amazon SNS
In AWS IoT Core we create a Thing to represent the client device, which in our case is the Teltonika router with the temperature sensor connected. The name of the thing is called the Client ID. We then create a security certificate, attach a permission policy to it and associate it with the Thing.


A client ID and the certificate is needed when configuring the Teltonika router so that it can authenticate with the AWS IoT Core MQTT endpoint and establish a secure connection. This endpoint is where the Teltonika router sends the sensor data using the MQTT protocol. With this you now have a Teltonika router that is able to send messages to AWS IoT Core.
Let's jump to the Transformation phase to set up the asset.
An asset model is a set of properties that represents a particular thing that you are trying to visualise. In our case there are actually two values. The first is the millivolts measurement that is being received from the Teltonika.

The second is a transform that calculates the temperature from the voltage.

You can see how in AWS IoT SiteWise we can implement a transformation using a transform definition with a formula. This formula converts millivolts to degrees Celcius based on the min and max range of the sensor.
Now that we have an asset model with the two properties, we can create the AWS IoT Core rule that extracts the timestamp and millivolts value from the MQTT message and forwards it to AWS IoT SiteWise and thus connecting the ingestion stage to the transformation stage.

What this configuration does is it essentially says: "Take the t value from the message and make that the timestamp. Take the d value from the message and make that the value. Send this timestamp and value to the given asset and asset property as defined by the asset ID and property ID."
The last phase before visualisation is the Storage phase. The great thing about AWS IoT SiteWise is that the storage is handled automatically. As soon as the timestamp and values are updated, they are also stored. This means we actually don't need to do any extra work for the storage phase.
Let's now look at the Visualisation and Alerts phases.
These two phases will leverage Amazon Managed Grafana, which is a fully managed version of Grafana that you can enable at the click of a button and start visualising data from AWS IoT SiteWise. The integration between Grafana and IoT SiteWise asset models and properties is provided out of the box.
In this example there's a dashboard with a stat and a time series chart set up to visualise the current and historical temperature.
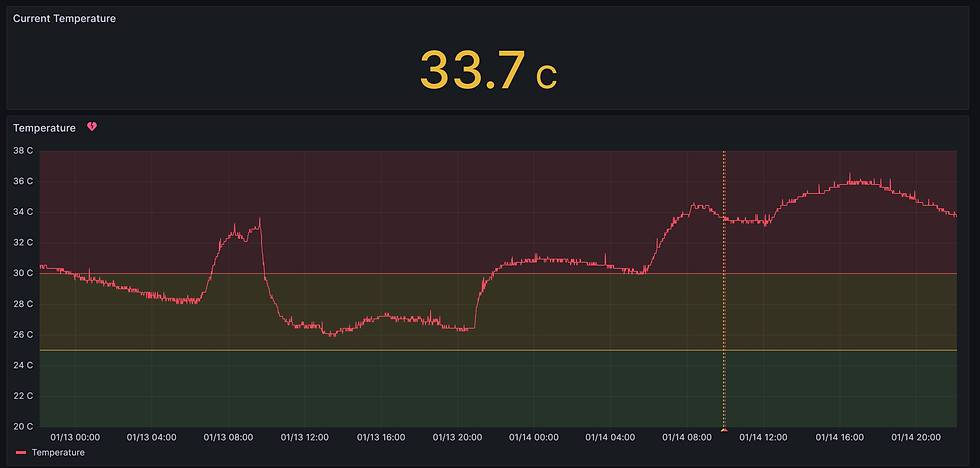
The neat thing is that Amazon Managed Grafana comes standard with many different visualisation options as well as secure login and hosting on AWS.
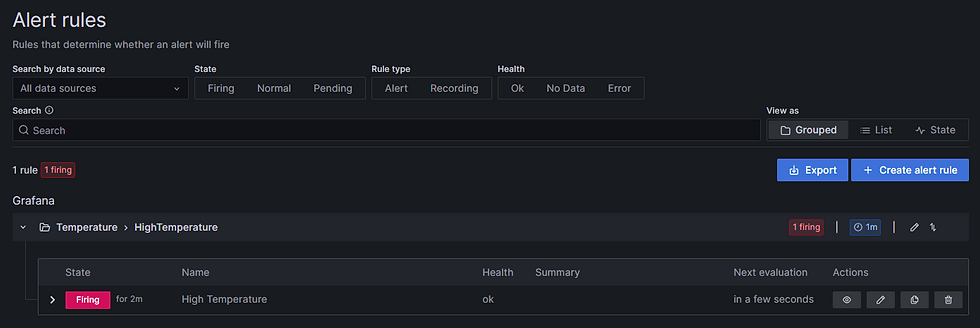
You can configure alerts with many different options such as thresholds, evaluation timing, contacts and contact groups. When a particular threshold is reached the alert will go into Firing state.
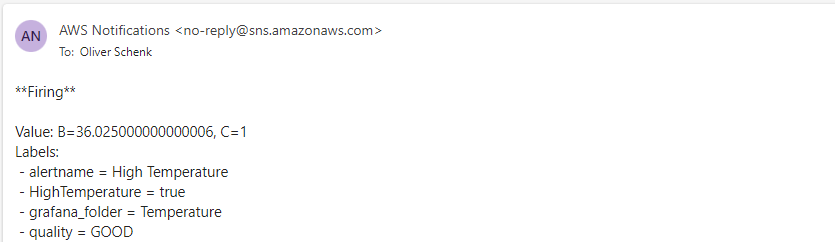
You can set up AWS SNS to send notifications to Email and other destinations such as SMS. The integration with SNS is provided by Grafana, but you just need to subscribe to the topic.
In this guide we demonstrated how managed cloud services can be used to achieve fast results where you have simple use cases and without compromising security or reliability. Best of all, simple use cases like this will cost almost nothing.
If you need help, Cloudea can help you implement data solutions based on AWS IoT services and most types of field devices and sensors. Contact us to find out more!

Comments